DebuggingToolsforWindows
k,kb,kc,kd,kp,kP,kv(DisplayStackBacktrace)
Thek*commandsdisplaythestackframeofthegiventhread,togetherwithrelatedinformation..
Syntax
User-Mode
[~Thread]k[b|p|P|v][c][n][f][L][FrameCount]
[~Thread]k[b|p|P|v][c][n][f][L]=BasePtr[FrameCount]
[~Thread]k[b|p|P|v][c][n][f][L]=BasePtrStackPtrInstructionPtr
[~Thread]kd[WordCount]
Kernel-Mode
[Processor]k[b|p|P|v][c][n][f][L][FrameCount]
[Processor]k[b|p|P|v][c][n][f][L]=BasePtr[FrameCount]
[Processor]k[b|p|P|v][c][n][f][L]=BasePtrStackPtrInstructionPtr
[Processor]kd[WordCount]
Parameters
Thread
Specifiesthethreadwhosestackistobedisplayed.Ifyouomitthisparameter,thestackofthecurrentthreadisdisplayed.Formoreinformationaboutthreadsyntax,seeThreadSyntax.Youcanspecifythreadsonlyinusermode.
Processor
Specifiestheprocessorwhosestackistobedisplayed.Formoreinformationaboutprocessorsyntax,seeMultiprocessorSyntax.Youcanspecifyprocessorsonlyinkernelmode.
b
Displaysthefirstthreeparametersthatarepassedtoeachfunctioninthestacktrace.
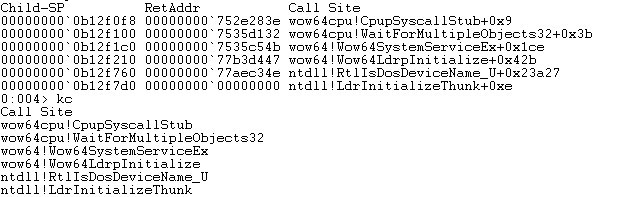
c
Displaysacleanstacktrace.Eachdisplaylineincludesonlythemodulenameandthefunctionname.
p
Displaysalloftheparametersforeachfunctionthatiscalledinthestacktrace.Theparameterlistincludeseachparameter'sdatatype,name,andvalue.Thepoptioniscasesensitive.Thisparameterrequiresfullsymbolinformation.
P
Displaysalloftheparametersforeachfunctionthatiscalledinthestacktrace,likethepparameter.However,forP,thefunctionparametersareprintedonasecondlineofthedisplay,insteadofonthesamelineastherestofthedata.
v
Displaysframepointeromission(FPO)information.Onx86-basedprocessors,thedisplayalsoincludescallingconventioninformation.
n
Displaysframenumbers.
f
Displaysthedistancebetweenadjacentframes.Thisdistanceisthenumberofbytesthatseparatetheframesontheactualstack.
L
Hidessourcelinesinthedisplay.Liscasesensitive.
FrameCount
Specifiesthenumberofstackframestodisplay.Youshouldspecifythisnumberinhexadecimalformat,unlessyouhavechangedtheradixbyusingthen(SetNumberBase)command.Thedefaultvalueis20(0x14),unlessyouhavechangedthedefaultvaluebyusingthe.kframes(SetStackLength)command.
BasePtr
Specifiesthebasepointerforthestacktrace.TheBasePtrparameterisavailableonlyifthereisanequalsign(=)afterthecommand.Onanx86-basedprocessor,youcanaddonemoreparameterafterBasePtr(whichisinterpretedastheFrameCountparameter)ortwomoreparametersafterBasePtr(whichareinterpretedastheStackPtrandInstructionPtrparameters).
StackPtr
(x86-basedprocessoronly)Specifiesthestackpointerforthestacktrace.IfyouomitStackPtrandInstructionPtr,thecommandusesthestackpointerthattheespregisterspecifiesandtheinstructionpointerthattheeipregisterspecifies.
InstructionPtr
(x86-basedprocessoronly)Specifiestheinstructionpointerforthestacktrace.IfyouomitStackPtrandInstructionPtr,thecommandusesthestackpointerthattheespregisterspecifiesandtheinstructionpointerthattheeipregisterspecifies.
WordCount
SpecifiesthenumberofDWORD_PTRvaluesinthestacktodump.Thedefaultvalueis20(0x14),unlessyouchangedthedefaultvaluebyusingthe.kframes(SetStackLength)command.
Environment
ModesUsermode,kernelmode
TargetsLive,crashdump
PlatformsAll
Comments
Whenyouissuethek,kb,kp,kP,orkvcommand,astacktraceisdisplayedinatabularformat.Iflineloadingisenabled,sourcemodulesandlinenumbersarealsodisplayed.
Thestacktraceincludesthebasepointerforthestackframe,thereturnaddress,andfunctionnames.
IfyouusethekporkPcommand,thefullparametersforeachfunctionthatiscalledinthestacktracearedisplayed.Theparameterlistincludeseachparameter'sdatatype,name,andvalue.
Thiscommandmightbeslow.Forexample,whenMyFunction1callsMyFunction2,thedebuggermusthavefullsymbolinformationforMyFunction1todisplaytheparametersthatarepassedinthiscall.ThiscommanddoesnotfullydisplayinternalMicrosoftWindowsroutinesthatarenotexposedinpublicsymbols.
Ifyouusethekborkvcommand,thefirstthreeparametersthatarepassedtoeachfunctionaredisplayed.Ifyouusethekvcommand,FPOdataisalsodisplayed.
Onanx86-basedprocessor,thekvcommandalsodisplayscallingconventioninformation.
OnanItanium-basedprocessor,thekvcommandalsocausesnonvolatileregisterstobedisplayed.Thisinformationenablesyoutotracetheregisterstack.
Whenyouusethekvcommand,theFPOinformationisaddedattheendofthelineinthefollowingformat.
FPOtextMeaning
FPO:[non-Fpo]
NoFPOdatafortheframe.
FPO:[N1,N2,N3]
N1isthetotalnumberofparameters.
N2isthenumberofDWORDvaluesforthelocalvariables.
N3isthenumberofregistersthataresaved.
FPO:[N1,N2]TrapFrame@Address
N1isthetotalnumberofparameters.
N2isthenumberofDWORDvaluesforthelocals.
Addressistheaddressofthetrapframe.
FPO:TaskGateSegment:0
Segmentisthesegmentselectorforthetaskgate.
FPO:[EBP0xBase]
Baseisthebasepointerfortheframe.
Thekdcommanddisplaystherawstackdata.EachDWORDvalueisdisplayedonaseparateline.Symbolinformationisdisplayedforthoselinestogetherwithassociatedsymbols.Thisformatcreatesamoredetailedlistthantheotherk*commands.Thekdcommandisequivalenttoadds(DisplayMemory)commandthatusesthestackaddressasitsparameter.
Ifyouwantastacktracethatbeginssomewhereotherthanthecurrentstacklocation,youcanusetheBasePtrparametertospecifythebasepointervalue.Ifyouarespecifyingthebasepointervalueonanx86-basedprocessor,youshouldspecifyBasePtr,StackPtr,andInstructionPtr.Theseparametersshouldbethevaluesofebp,esp,andeipthatcorrespondtothestacktracethatyouwant.IfyouspecifyBasePtrandomitStackPtrandInstructionPtr,youmightreceiveincorrectresultsifthereareFPOframespresent.
Ifyouusethekcommandatthebeginningofafunction(beforethefunctionprologhasbeenexecuted),youreceiveincorrectresults.Thedebuggerusestheframeregistertocomputethecurrentbacktrace,andthisregisterisnotsetcorrectlyforafunctionuntilitsprologhasbeenexecuted.
Inusermode,thestacktraceisbasedonthestackofthecurrentthread.Formoreinformationaboutthreads,seeControllingProcessesandThreads.
Inkernelmode,thestacktraceisbasedonthecurrentregistercontext.Youcansettheregistercontexttomatchaspecificthread,contextrecord,ortrapframe.
AdditionalInformation
Formoreinformationaboutstacktracesandotherwaystodisplaystacktraces,seeViewingtheCallStack.Formoreinformationabouttheregistercontextandothercontextsettings,seeChangingContexts.
?2009MicrosoftCorporation
Sendfeedbackonthistopic
DebuggingToolsforWindows
January17,2009
Buildmachine:CAPEBUILD
AdditionalInformation
Formoreinformationaboutstacktracesandotherwaystodisplaystacktraces,seeViewingtheCallStack.Formoreinformationabouttheregistercontextandothercontextsettings,seeChangingContexts.
|